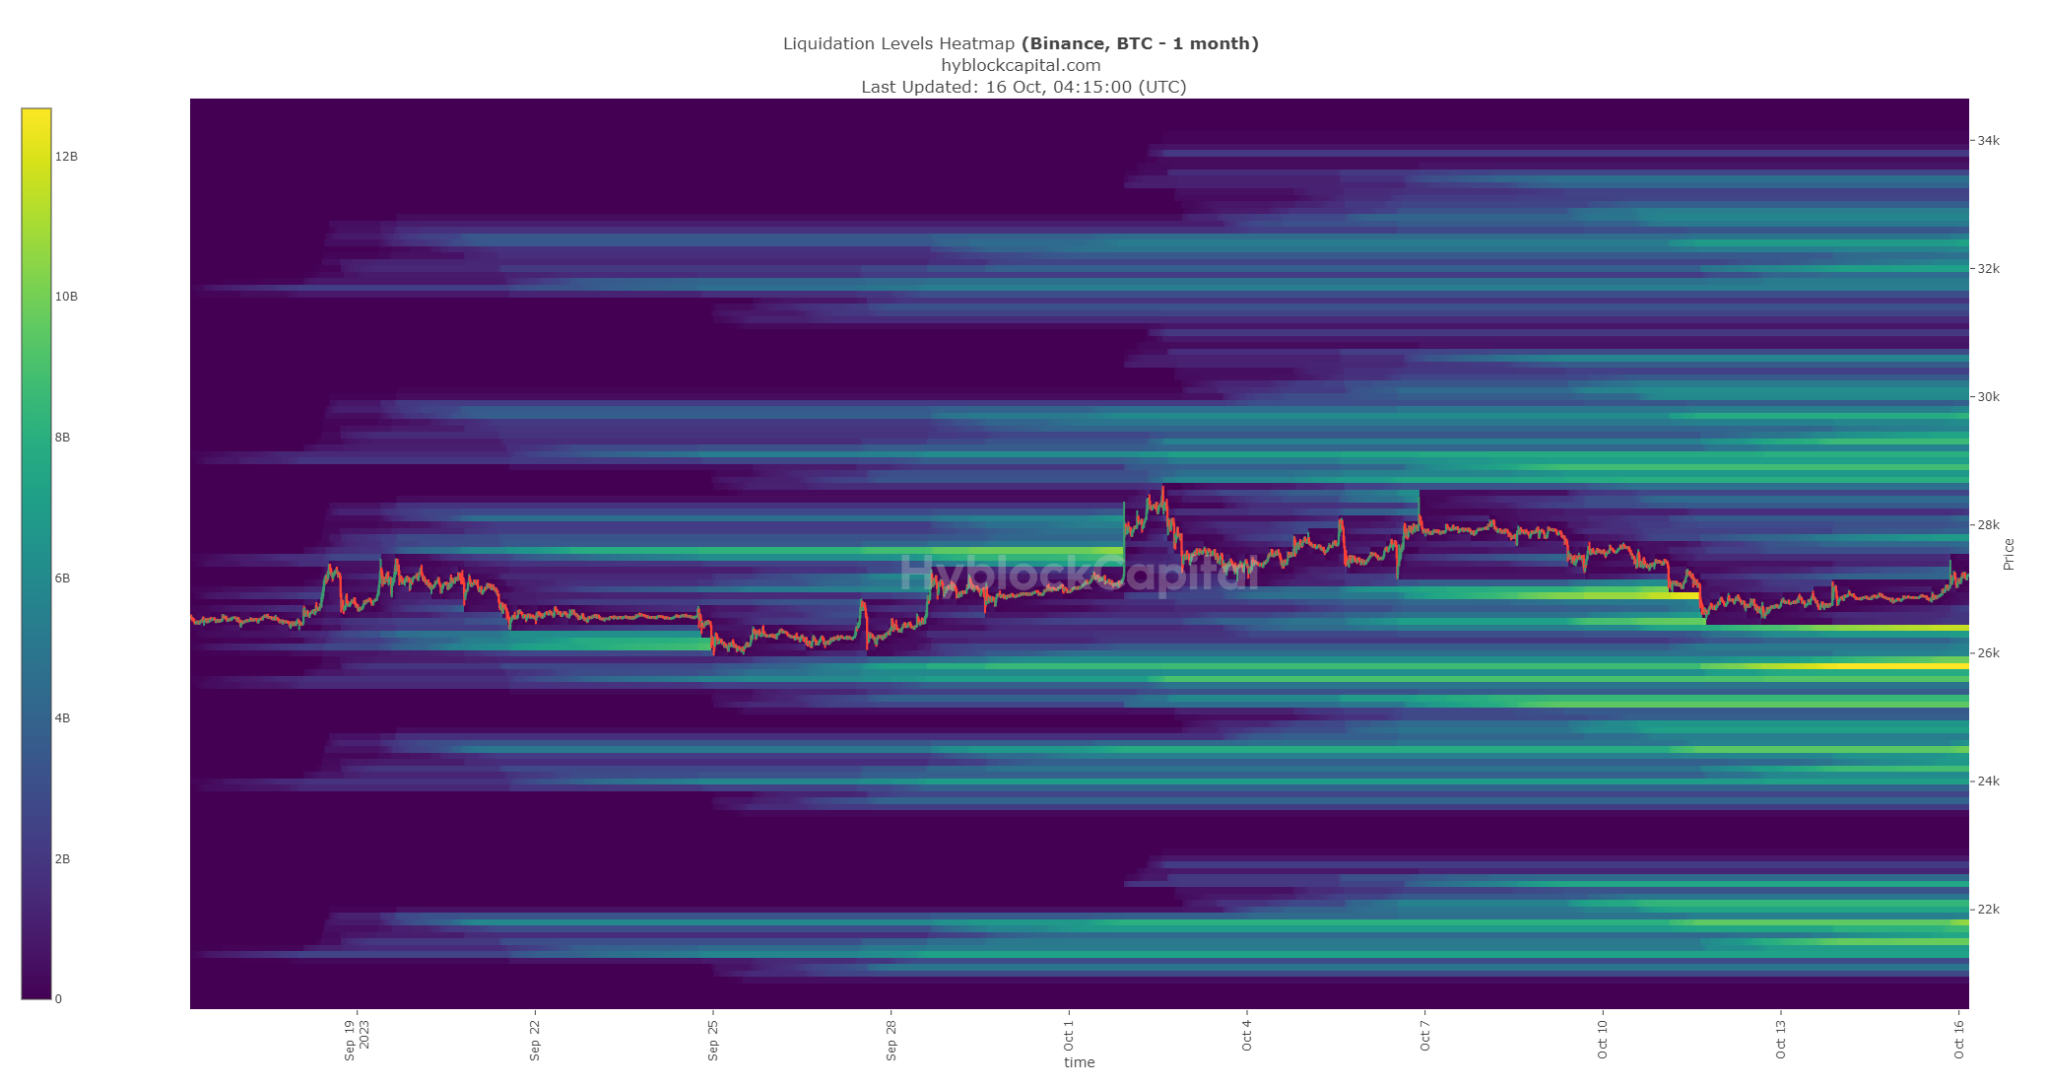
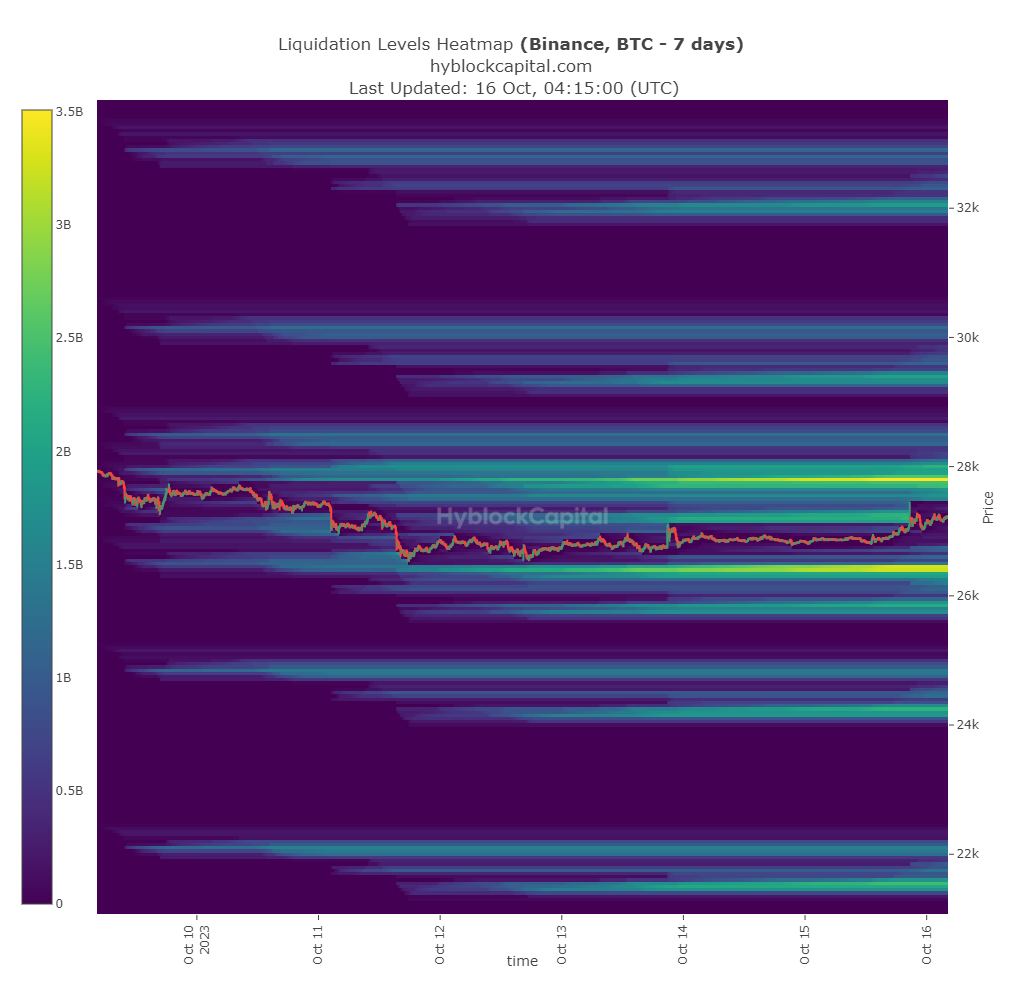
Hyblock Charts: On the 1-month chart, there is a liquidation level below at $26,400 and $25,800, and nothing significant above the price. Onto the 7-day chart, there is a level above the price at $27,800 and below the price at $26,400, which is a 1-month level as well.
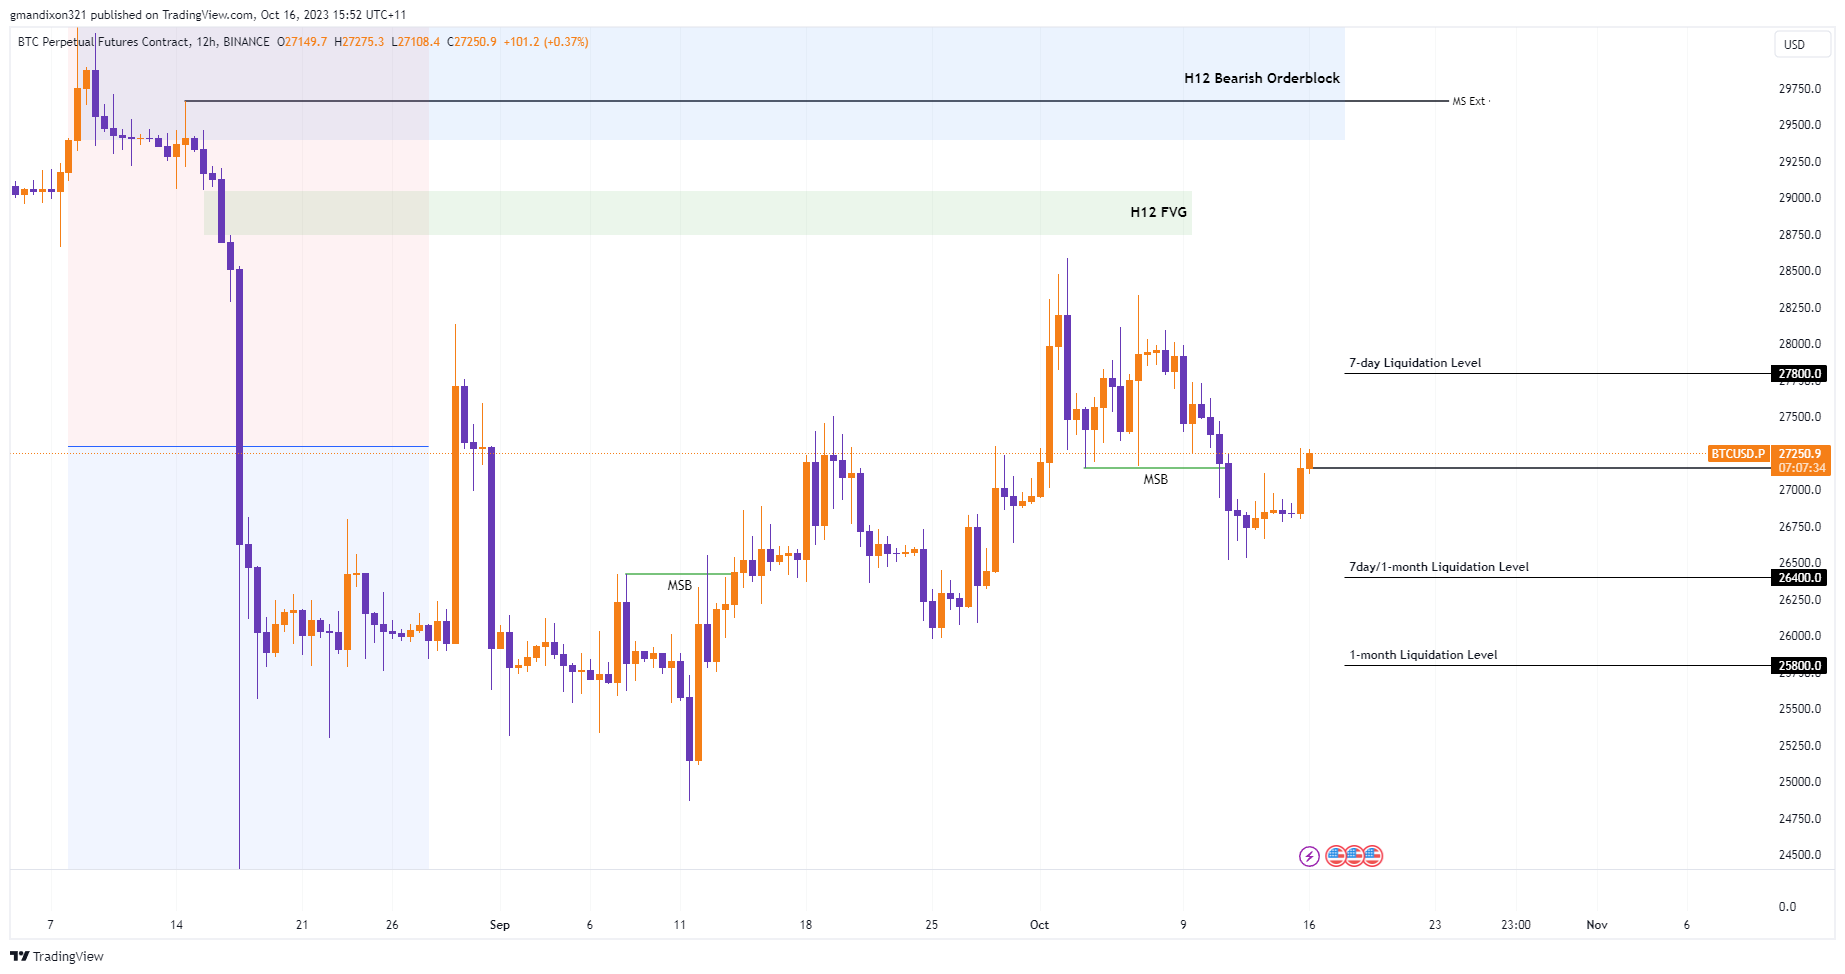
Bitcoin Chart (H12): As mentioned last week, I thought we might continue the sell-off to the downside and start going for the liquidations below the price. I did think we might have had another spike up before moving to the downside, but we just continued downward. Looking over the current chart, there is a Hyblock level above at $27,800, which could draw price before heading further to the downside. We have had an internal market structure break on H12 shown by the green line (MSB).
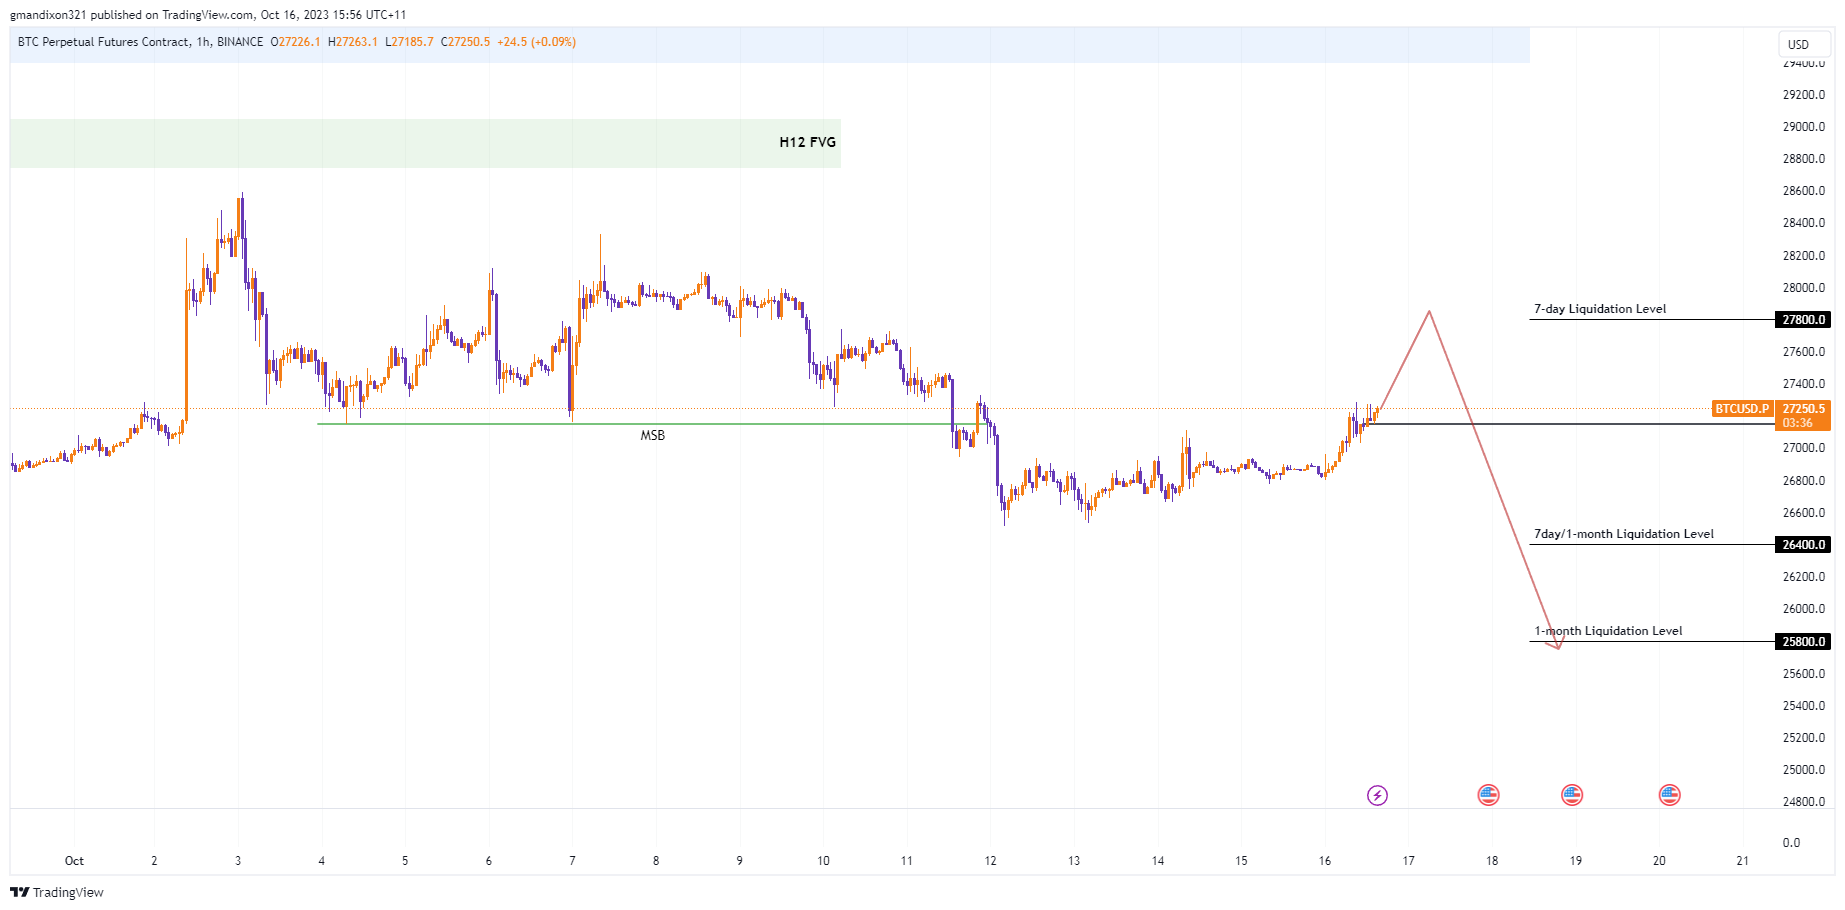
Bitcoin Chart (H1): Last week, I was looking to see if we could close above $28,000, which could have then gone for the buy-side liquidity at $28,500, but instead, we sold off into the Hyblock liquidation level below. Currently looking at the price, there isn’t a very clear direction. I do think we have started the downtrend to start seeking all the liquidation levels below the price with the H12 internal market structure break.


Welcome to the Sunday Bitcoin & Hyblock Charts.
Hyblock Charts: On the 1-month chart, there is a liquidation level below at $26,400 and $25,800, and nothing significant above the price. Onto the 7-day chart, there is a level above the price at $27,800 and below the price at $26,400, which is a 1-month level as well.
Bitcoin Chart (H12): As mentioned last week, I thought we might continue the sell-off to the downside and start going for the liquidations below the price. I did think we might have had another spike up before moving to the downside, but we just continued downward. Looking over the current chart, there is a Hyblock level above at $27,800, which could draw price before heading further to the downside. We have had an internal market structure break on H12 shown by the green line (MSB).
Bitcoin Chart (H1): Last week, I was looking to see if we could close above $28,000, which could have then gone for the buy-side liquidity at $28,500, but instead, we sold off into the Hyblock liquidation level below. Currently looking at the price, there isn’t a very clear direction. I do think we have started the downtrend to start seeking all the liquidation levels below the price with the H12 internal market structure break.
Weekly High-Impact News:
https://skribr.io/app/news/weekly-trading-data-summary/
Wishing everyone a successful trading week ahead!