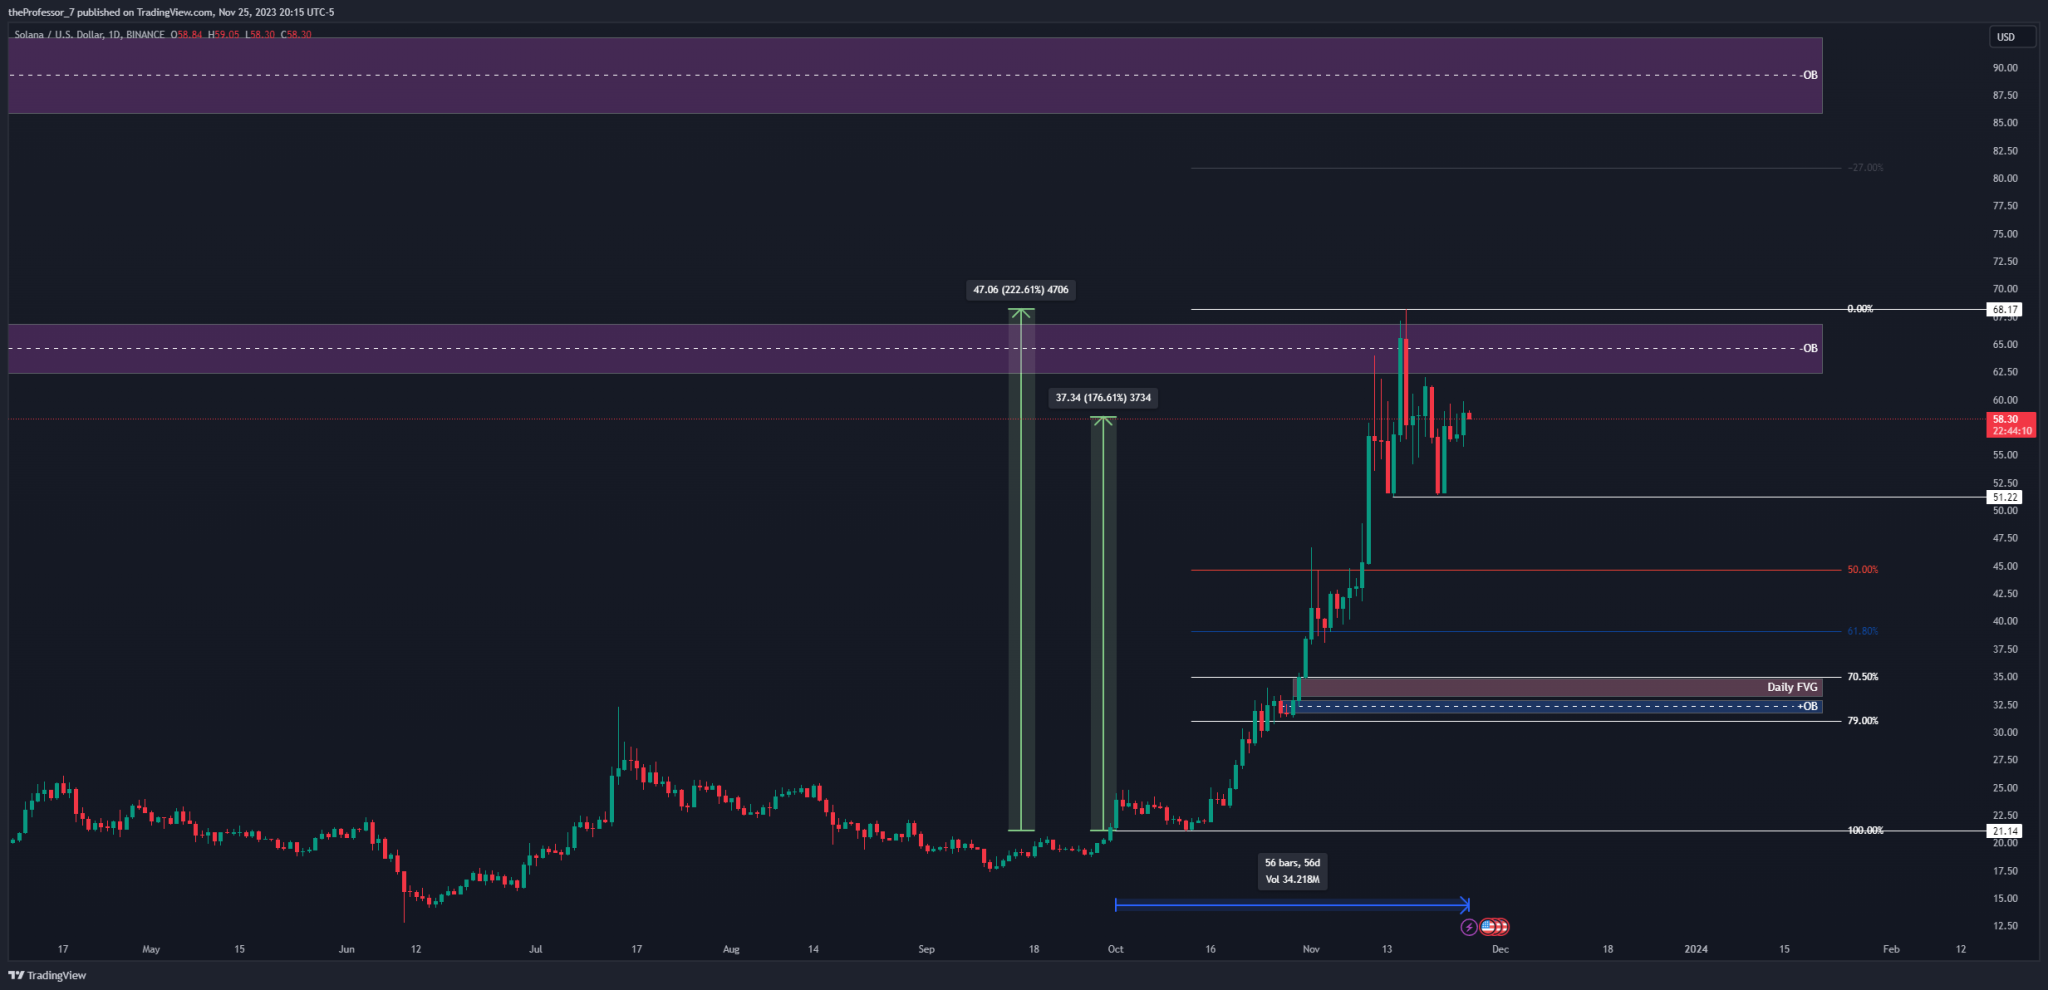
Solana has seen a notable increase in the past two months, with a 222% rise since the beginning of October, now standing at 176%. However, there hasn’t been a significant pullback yet, and as the wise old market saying goes, “what comes up must go down”. So, diving into Solana now for a quick fortune might be more of a high-wire act than a sure bet.
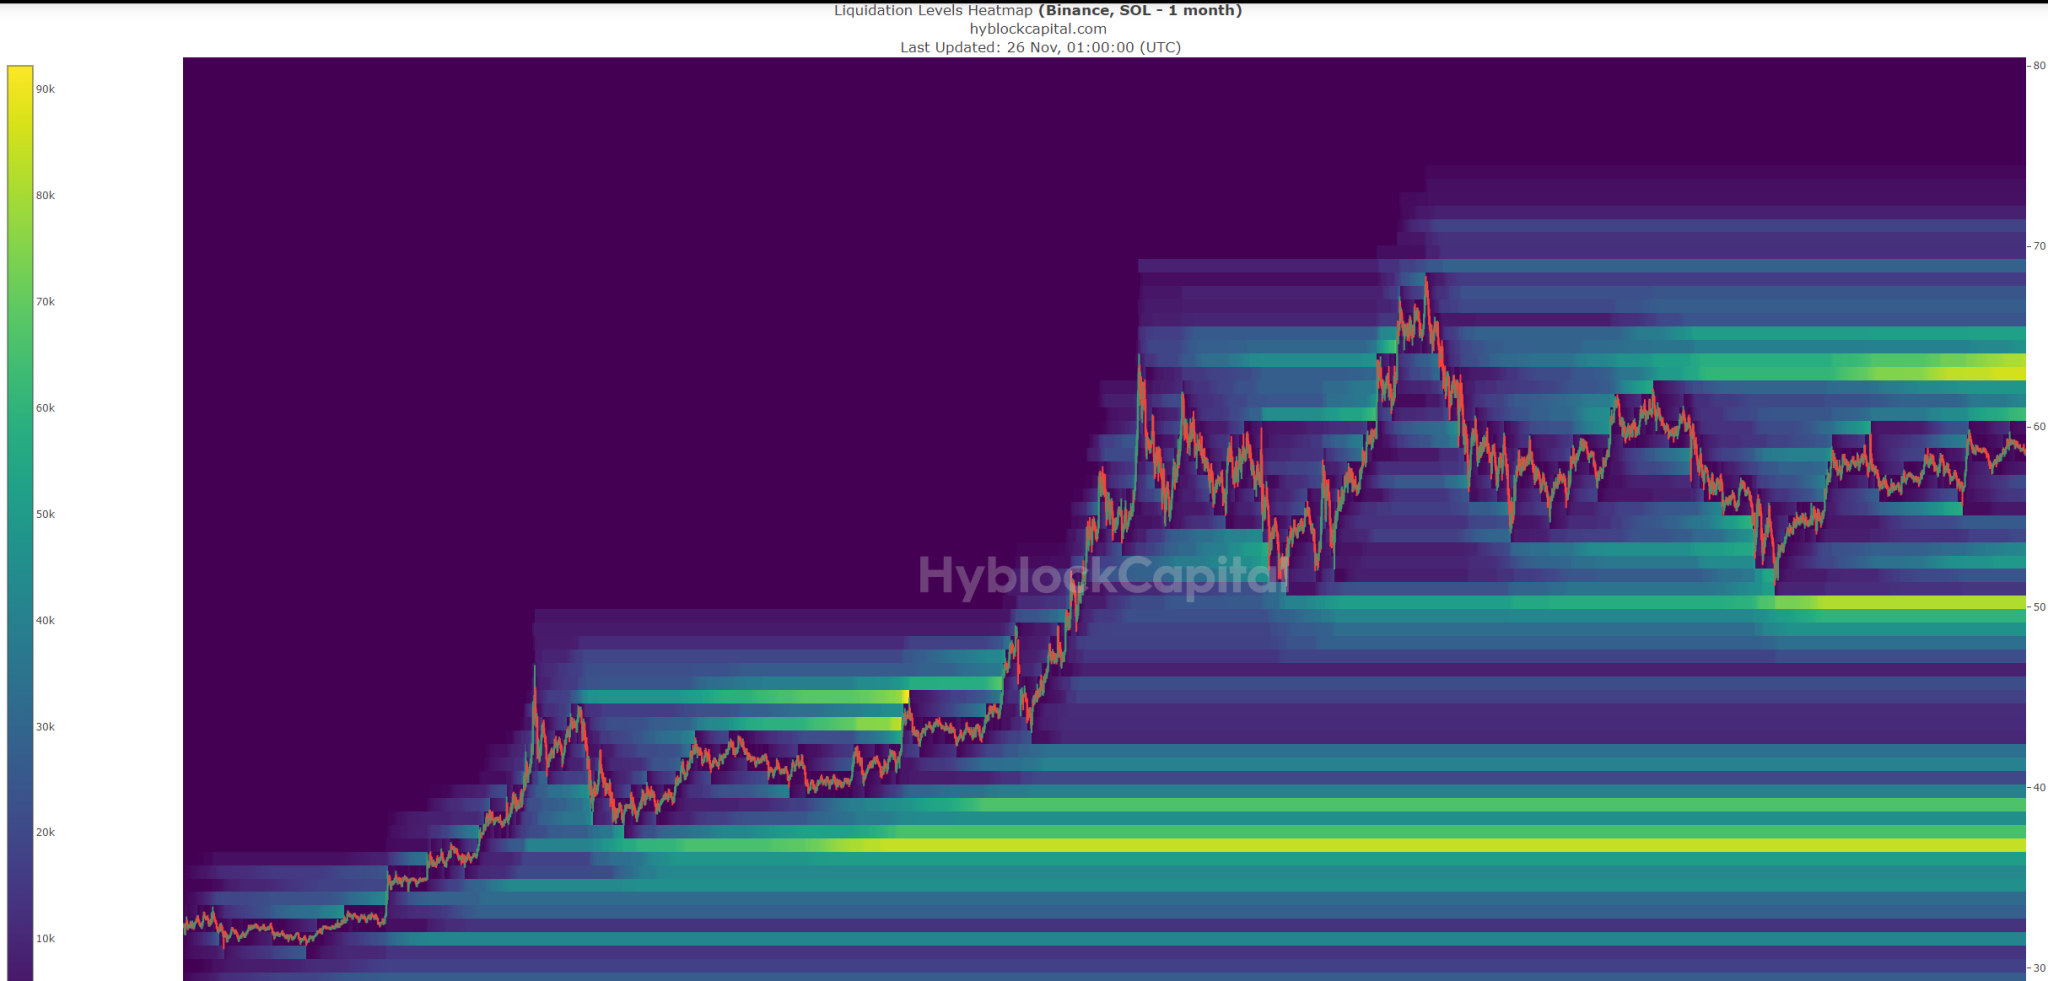
The first chart shows a rejection of Solana’s price at $68, indicating a possible short-term correction. Additionally, there’s potential liquidity (looking at our second chart) at $51, aligning with a short-term equal low. This could be where price draws on, at least temporarily. A more substantial correction could occur between the 61.8% – 79% Fibonacci levels, considering the presence of fair value gaps and a bullish order block, likely around the $38 mark which also lines up with deeper liquidity levels. This scenario would provide that healthy pullback we have been waiting for.
It’s important to also consider Bitcoin’s movements, as they often influence Solana’s trajectory. Contrasting this analysis, the US dollar index is currently showing bearish signs. A weaker dollar could lead to a stronger Bitcoin, which might, in turn, push Solana’s price higher.
Therefore, keeping an eye on both the DXY and BTCUSD is advisable for those interested in Solana’s market trends.


Solana has seen a notable increase in the past two months, with a 222% rise since the beginning of October, now standing at 176%. However, there hasn’t been a significant pullback yet, and as the wise old market saying goes, “what comes up must go down”. So, diving into Solana now for a quick fortune might be more of a high-wire act than a sure bet.
The first chart shows a rejection of Solana’s price at $68, indicating a possible short-term correction. Additionally, there’s potential liquidity (looking at our second chart) at $51, aligning with a short-term equal low. This could be where price draws on, at least temporarily. A more substantial correction could occur between the 61.8% – 79% Fibonacci levels, considering the presence of fair value gaps and a bullish order block, likely around the $38 mark which also lines up with deeper liquidity levels. This scenario would provide that healthy pullback we have been waiting for.
It’s important to also consider Bitcoin’s movements, as they often influence Solana’s trajectory. Contrasting this analysis, the US dollar index is currently showing bearish signs. A weaker dollar could lead to a stronger Bitcoin, which might, in turn, push Solana’s price higher.
Therefore, keeping an eye on both the DXY and BTCUSD is advisable for those interested in Solana’s market trends.