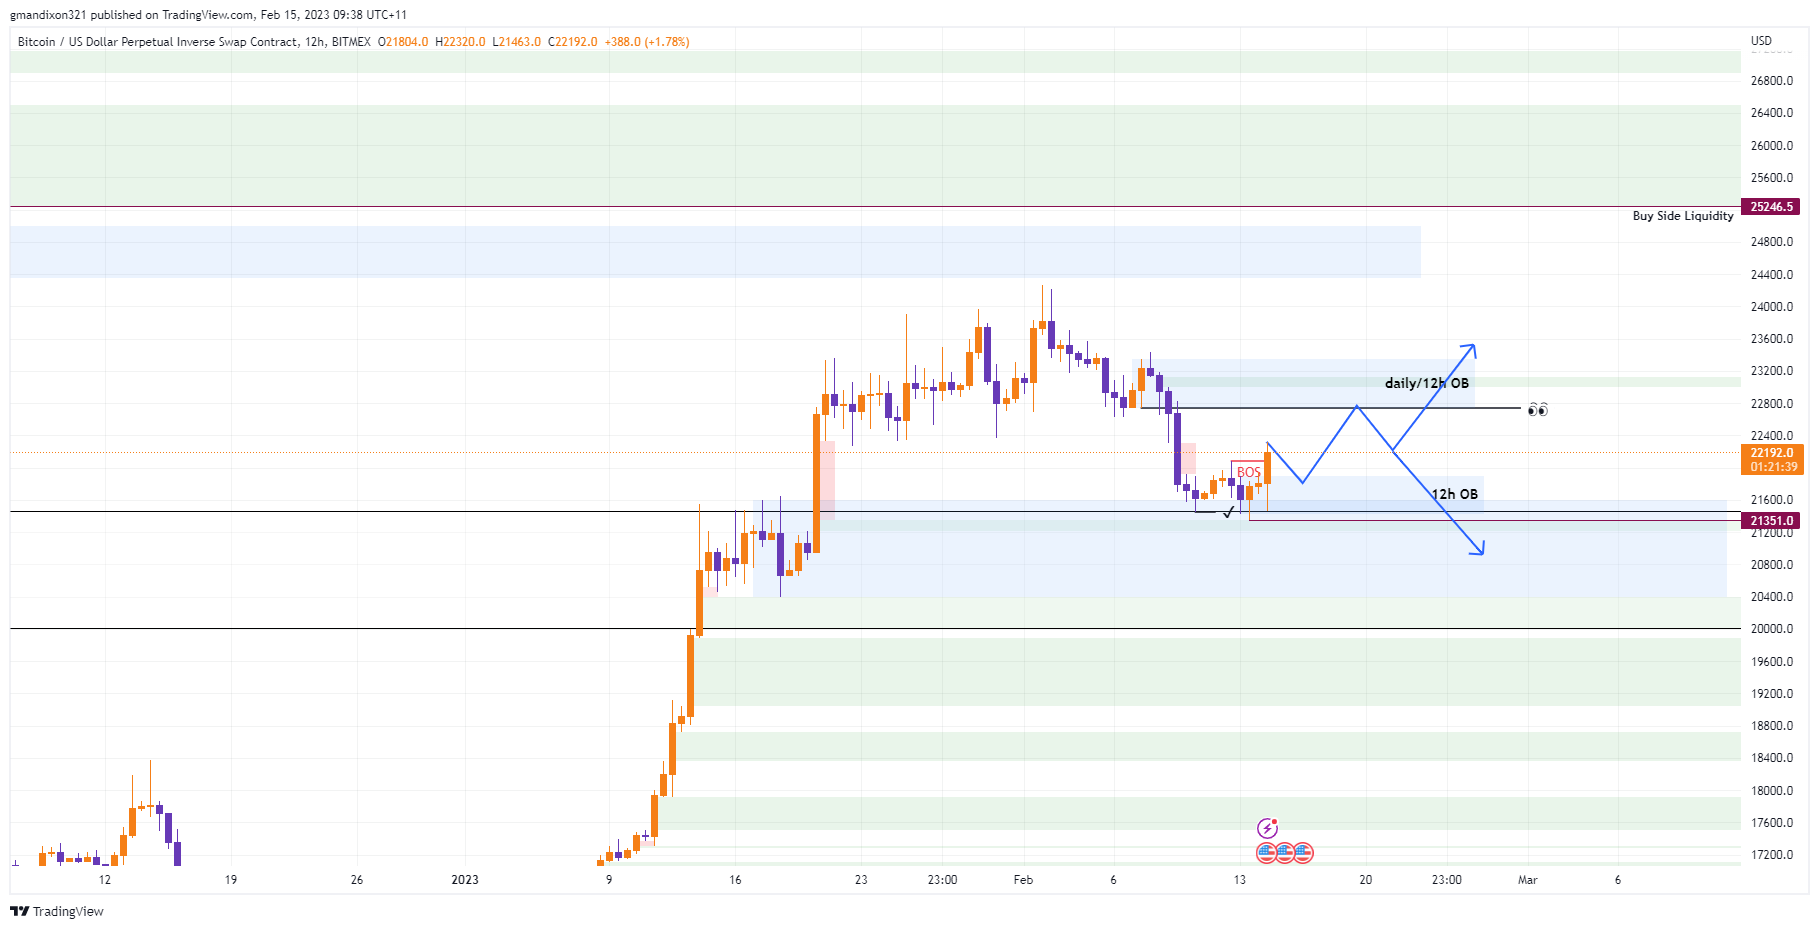
BTC 12h Chart
BTC/USD, 12H
Neutral
Feb 16, 2023
Feb 16, 2023
We never got the retest off the 12h bullish ob
just took off for the 25k buy side liquidity
it happens sometimes when it just leaves you behind and thats just trading and its hard not to chase something like that,
maybe on LTF there was a trade somewhere on the way up but its not something i like doing once you get a big bullish candles like that, its best to wait for a retracement and find an entry
Feb 19, 2023
Feb 19, 2023
Just an updated on the 12h chart
we had a nice bounce from the daily/breaker area
i will be looking for another sweep off the 25k area to stop out the early short traders


BTC/USD
12H
currently looking at btc 12h chart
i will look to go long on a bounce from the 12h bullish OB that has formed with the break of market structure and its taken liquidity with that wick showing me that there was buyers in that area to buy up everyone elses stop losses
then i look to go down into the 1h for a same formation but on the 1h , looking to only take it up to the 12h bearish OB
either at the 12h bearish ob which is a daily bearish ob aswell
we could bounce off that and form another higher low which to me showing some buying pressure and we could be looking to take out the buy side liquidity at around $25,000
or we have soild rejected from that 12h bearish ob and we look to continue to the downside where my targets would be $20,000 area taking out some internal sell side liquidity and then even further down