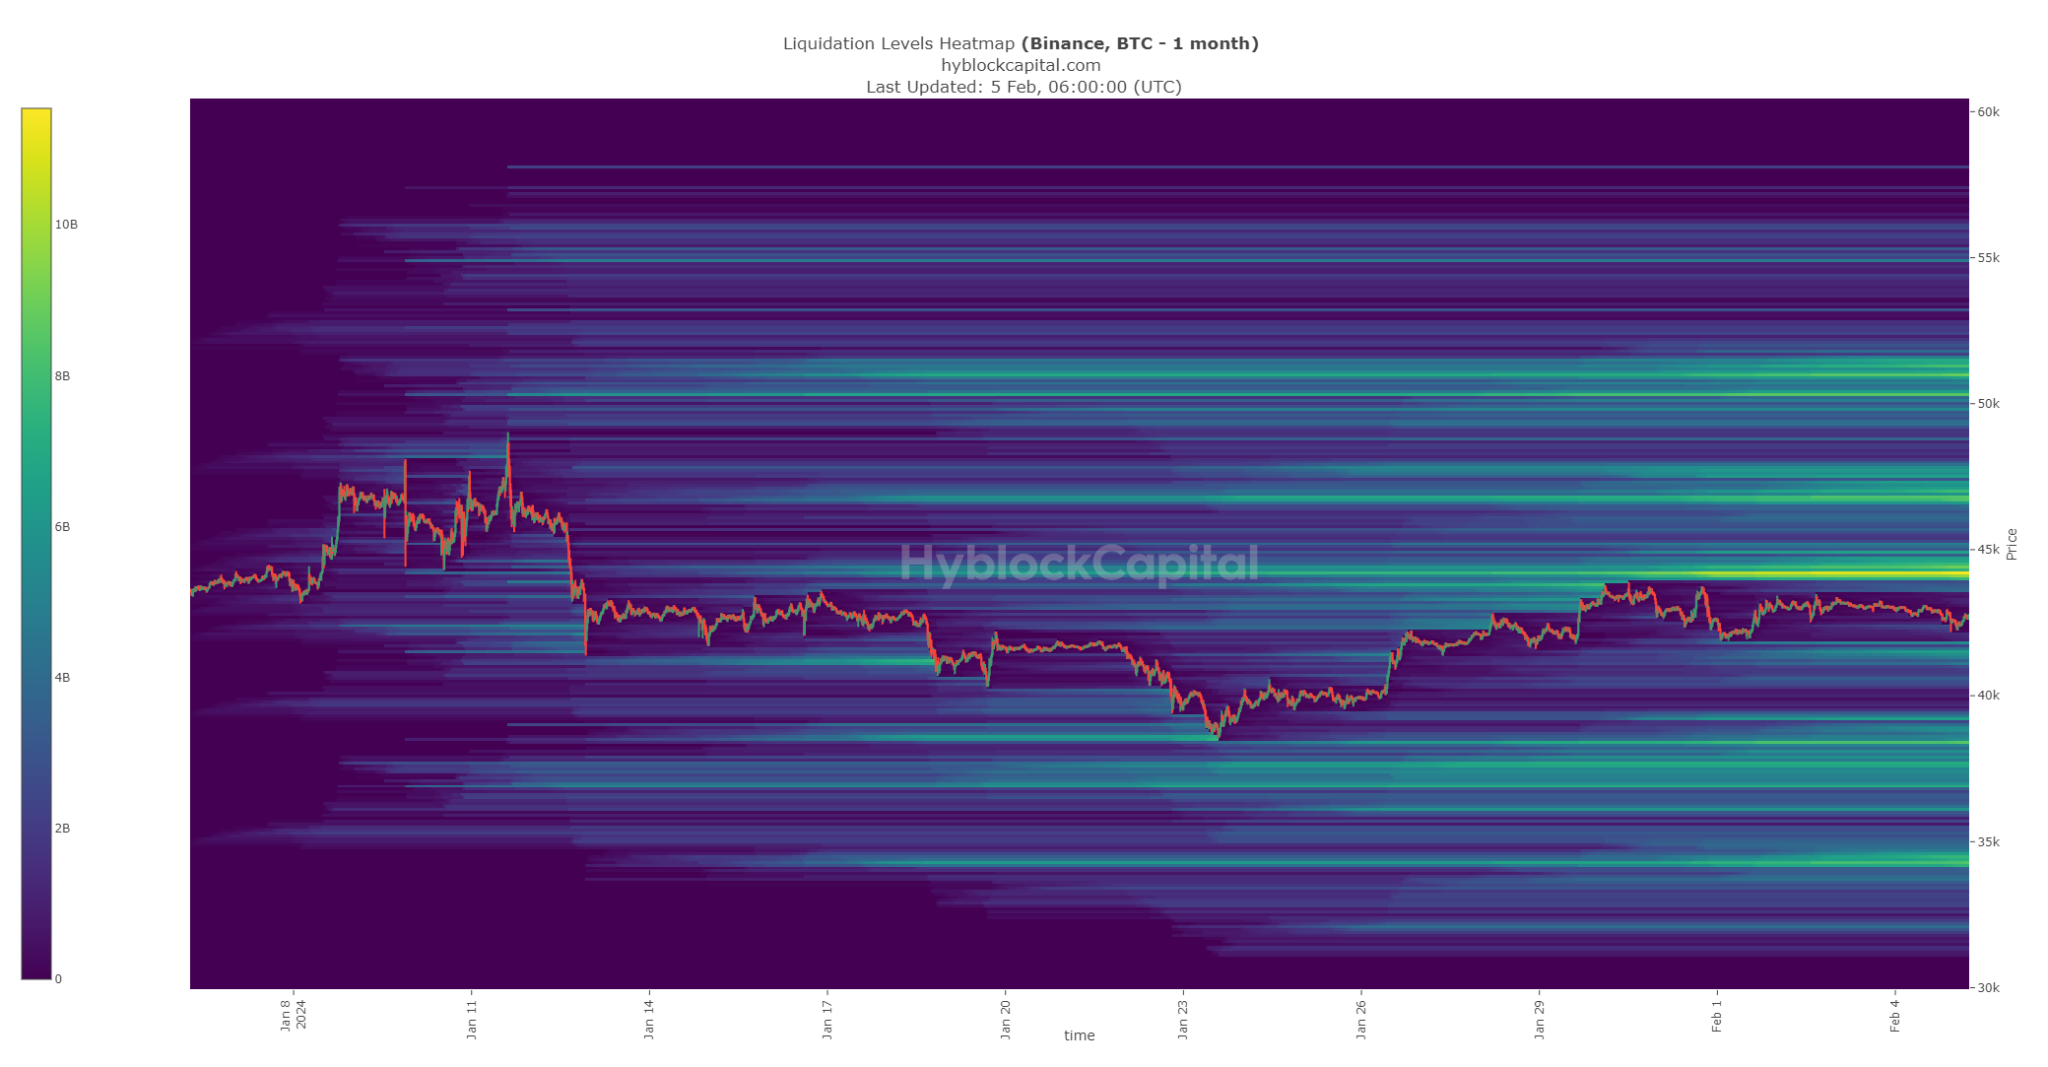
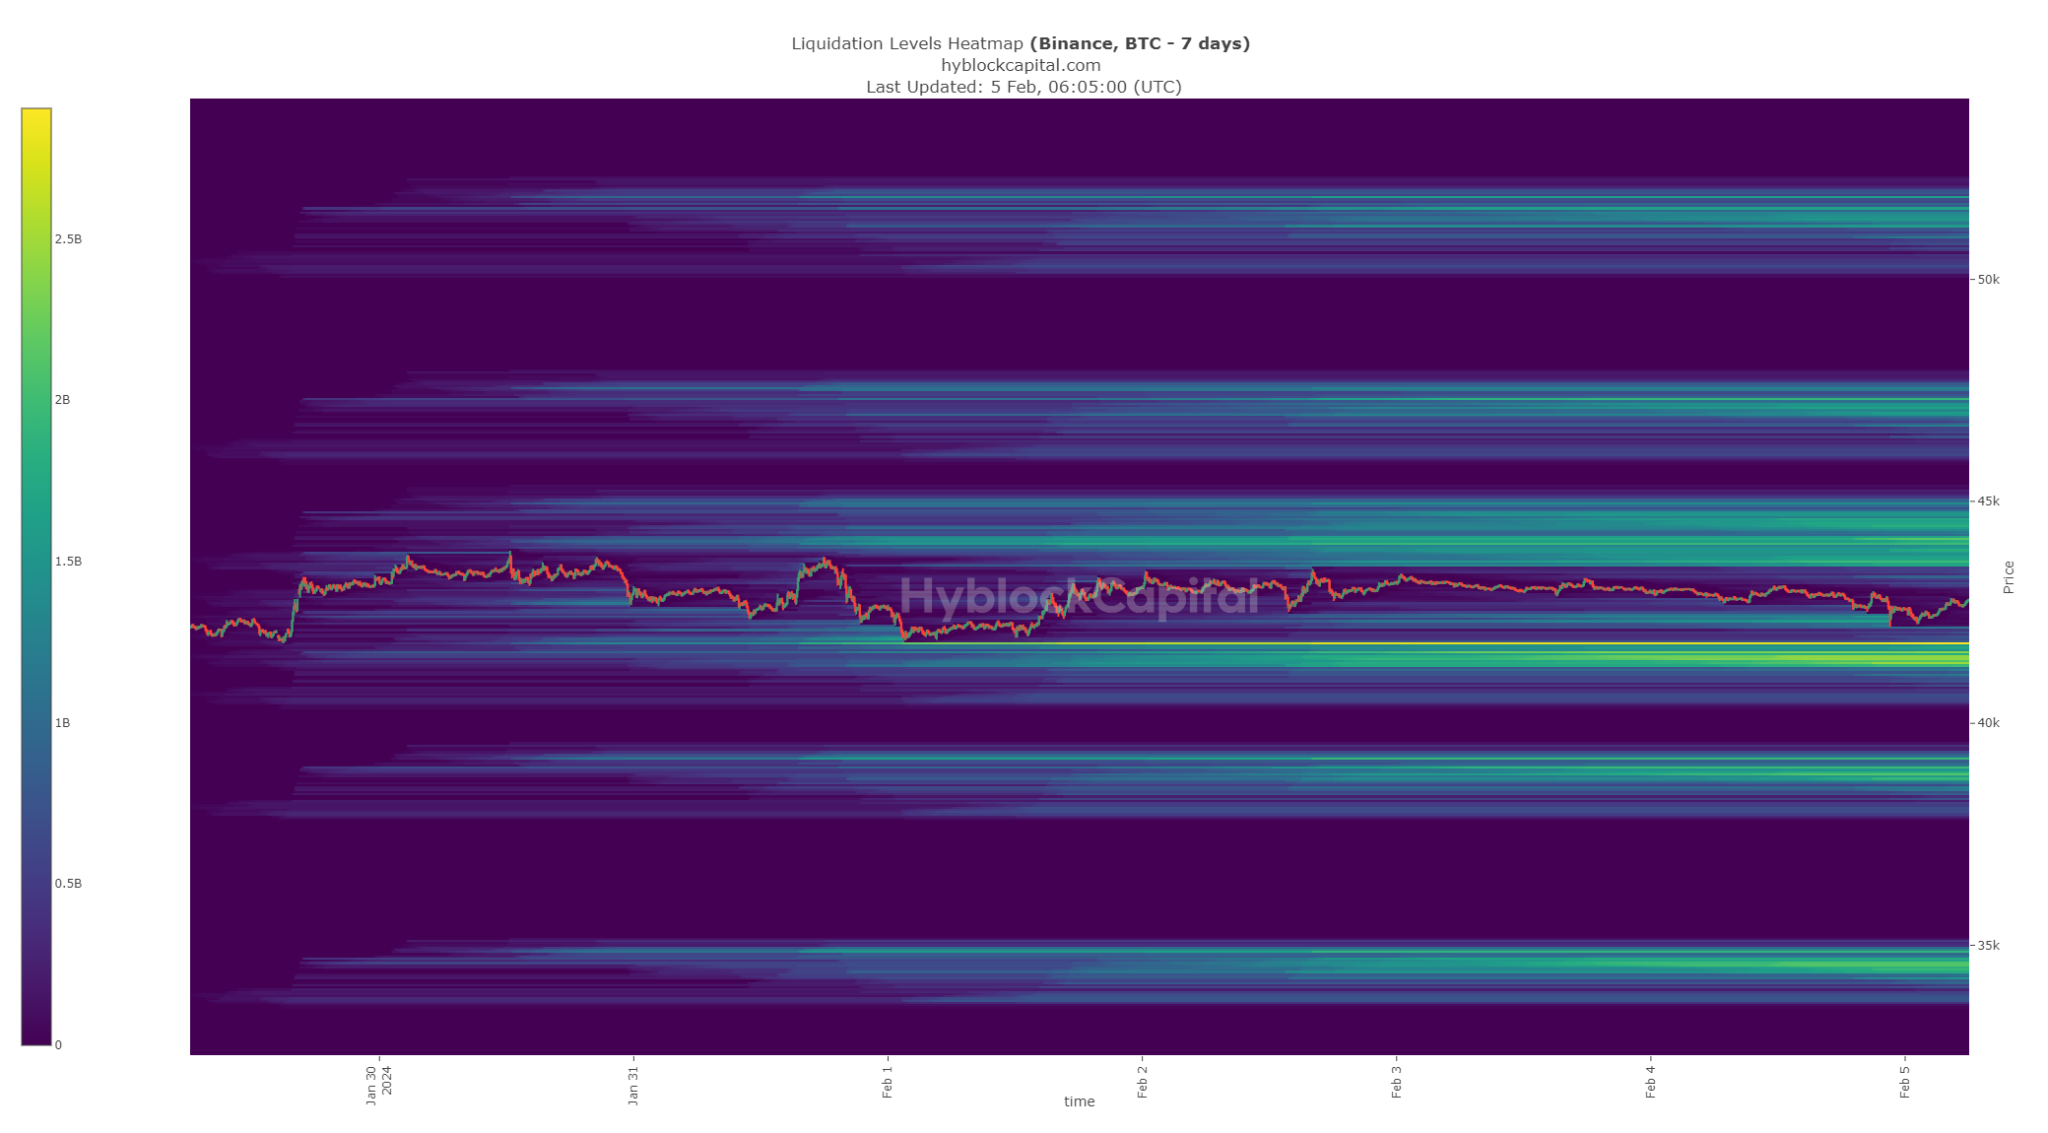
Hyblock Charts: Let’s examine the Hyblock liquidation levels, starting with the 1-month chart. Above the current price, there’s a notable accumulation of liquidations, particularly at $44,300, marked by a prominent yellow zone. While there are additional levels, they have yet to turn yellow. Below the current price, there’s limited activity. Shifting to the 7-day chart, substantial yellow zones emerge below the price, ranging from $41,800 to $41,300. Above the price, there aren’t yellow zones yet, but development is noticeable from $43,550 up to $44,350.
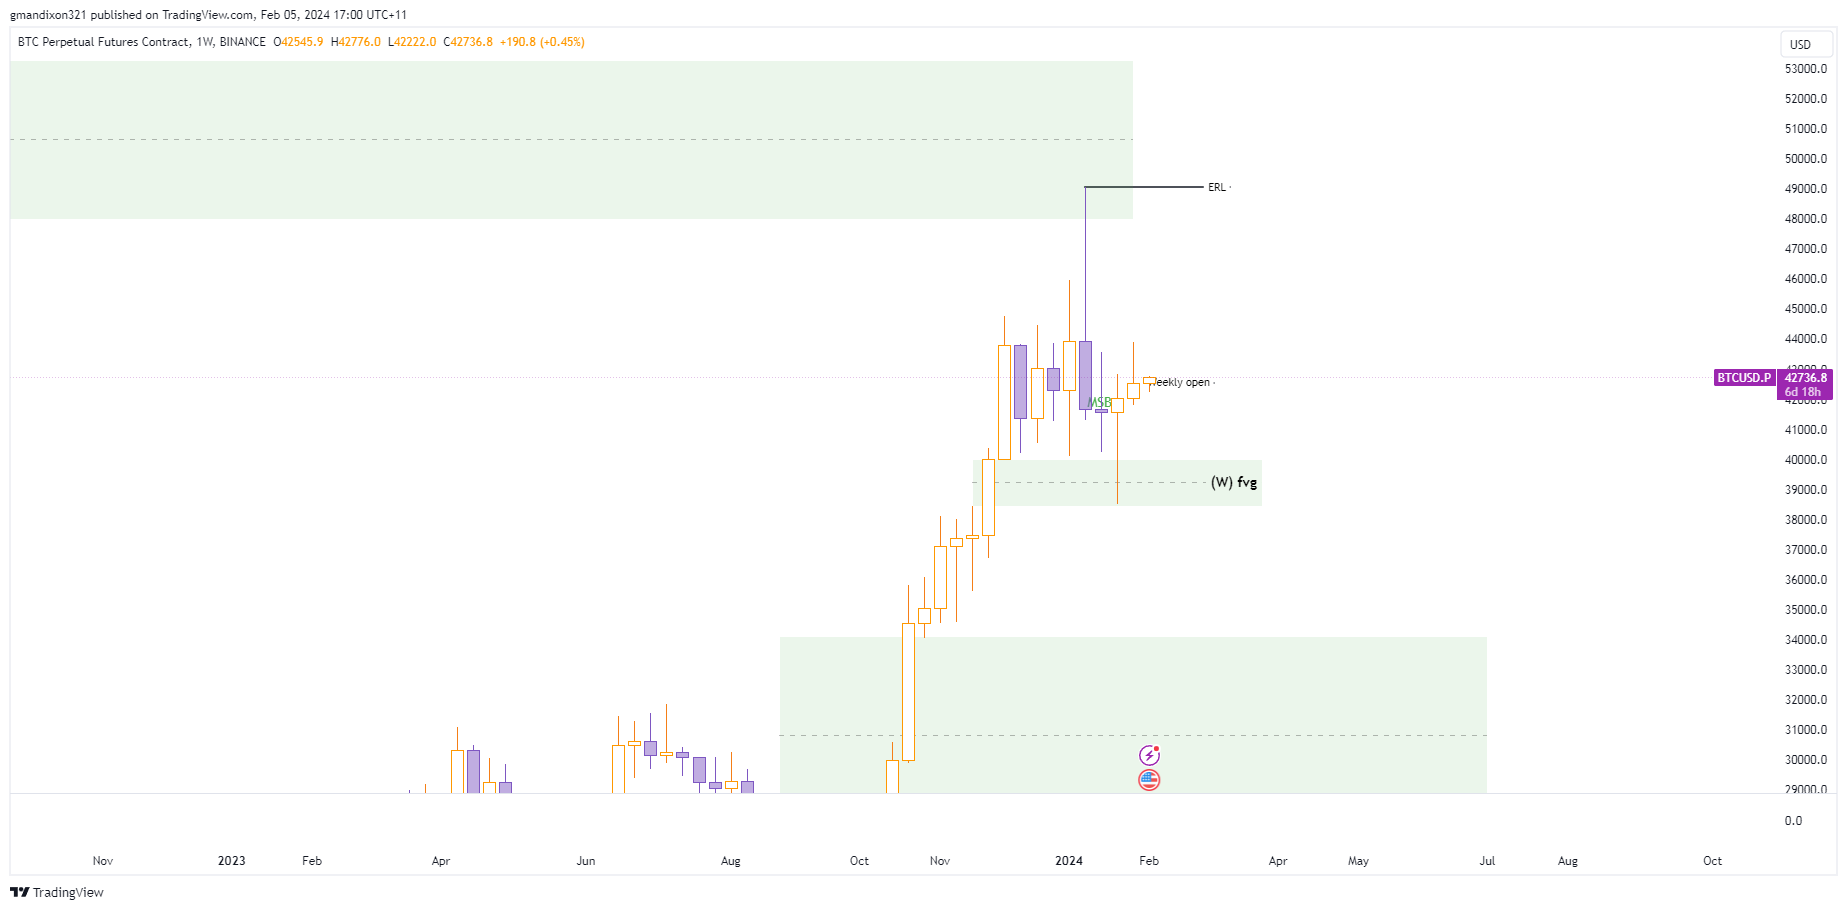
Bitcoin Chart (W): Transitioning to the weekly chart on Bitcoin, a noteworthy reaction occurred around the weekly fair value gap a few weeks ago, propelling the price into a steady uptrend.
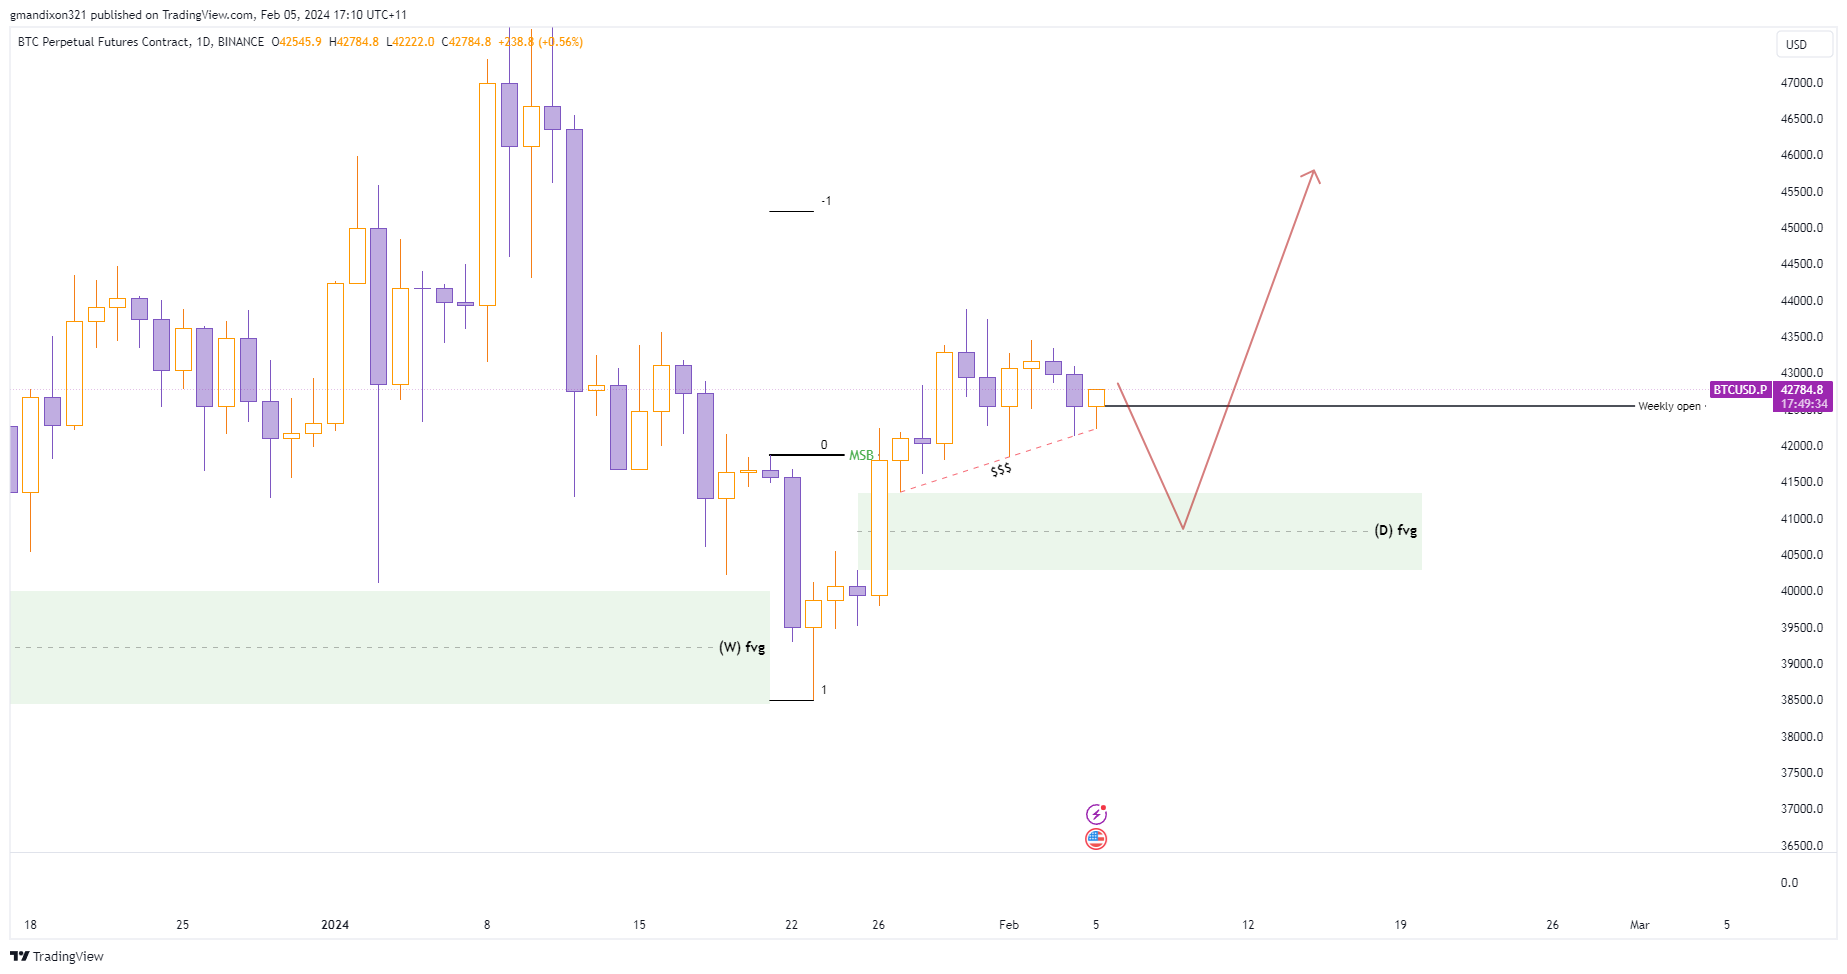
Bitcoin Chart (D): Examining the daily chart, after hitting the weekly fair value gap and experiencing a bounce, a significant daily fair value gap was established, accompanied by a market structure shift to the upside. Anticipating a potential revisit to this daily fair value gap, which would intersect with key Hyblock liquidation levels and address untapped lows. If a bullish reaction is observed within this daily fair value gap, it may present an opportunity for a long position, signaling further upside potential.


Bitcoin & Hyblock Update
Bitcoin IRL > ERL Weekly
Hyblock Charts: Let’s examine the Hyblock liquidation levels, starting with the 1-month chart. Above the current price, there’s a notable accumulation of liquidations, particularly at $44,300, marked by a prominent yellow zone. While there are additional levels, they have yet to turn yellow. Below the current price, there’s limited activity. Shifting to the 7-day chart, substantial yellow zones emerge below the price, ranging from $41,800 to $41,300. Above the price, there aren’t yellow zones yet, but development is noticeable from $43,550 up to $44,350.
Bitcoin Chart (W): Transitioning to the weekly chart on Bitcoin, a noteworthy reaction occurred around the weekly fair value gap a few weeks ago, propelling the price into a steady uptrend.
Bitcoin Chart (D): Examining the daily chart, after hitting the weekly fair value gap and experiencing a bounce, a significant daily fair value gap was established, accompanied by a market structure shift to the upside. Anticipating a potential revisit to this daily fair value gap, which would intersect with key Hyblock liquidation levels and address untapped lows. If a bullish reaction is observed within this daily fair value gap, it may present an opportunity for a long position, signaling further upside potential.