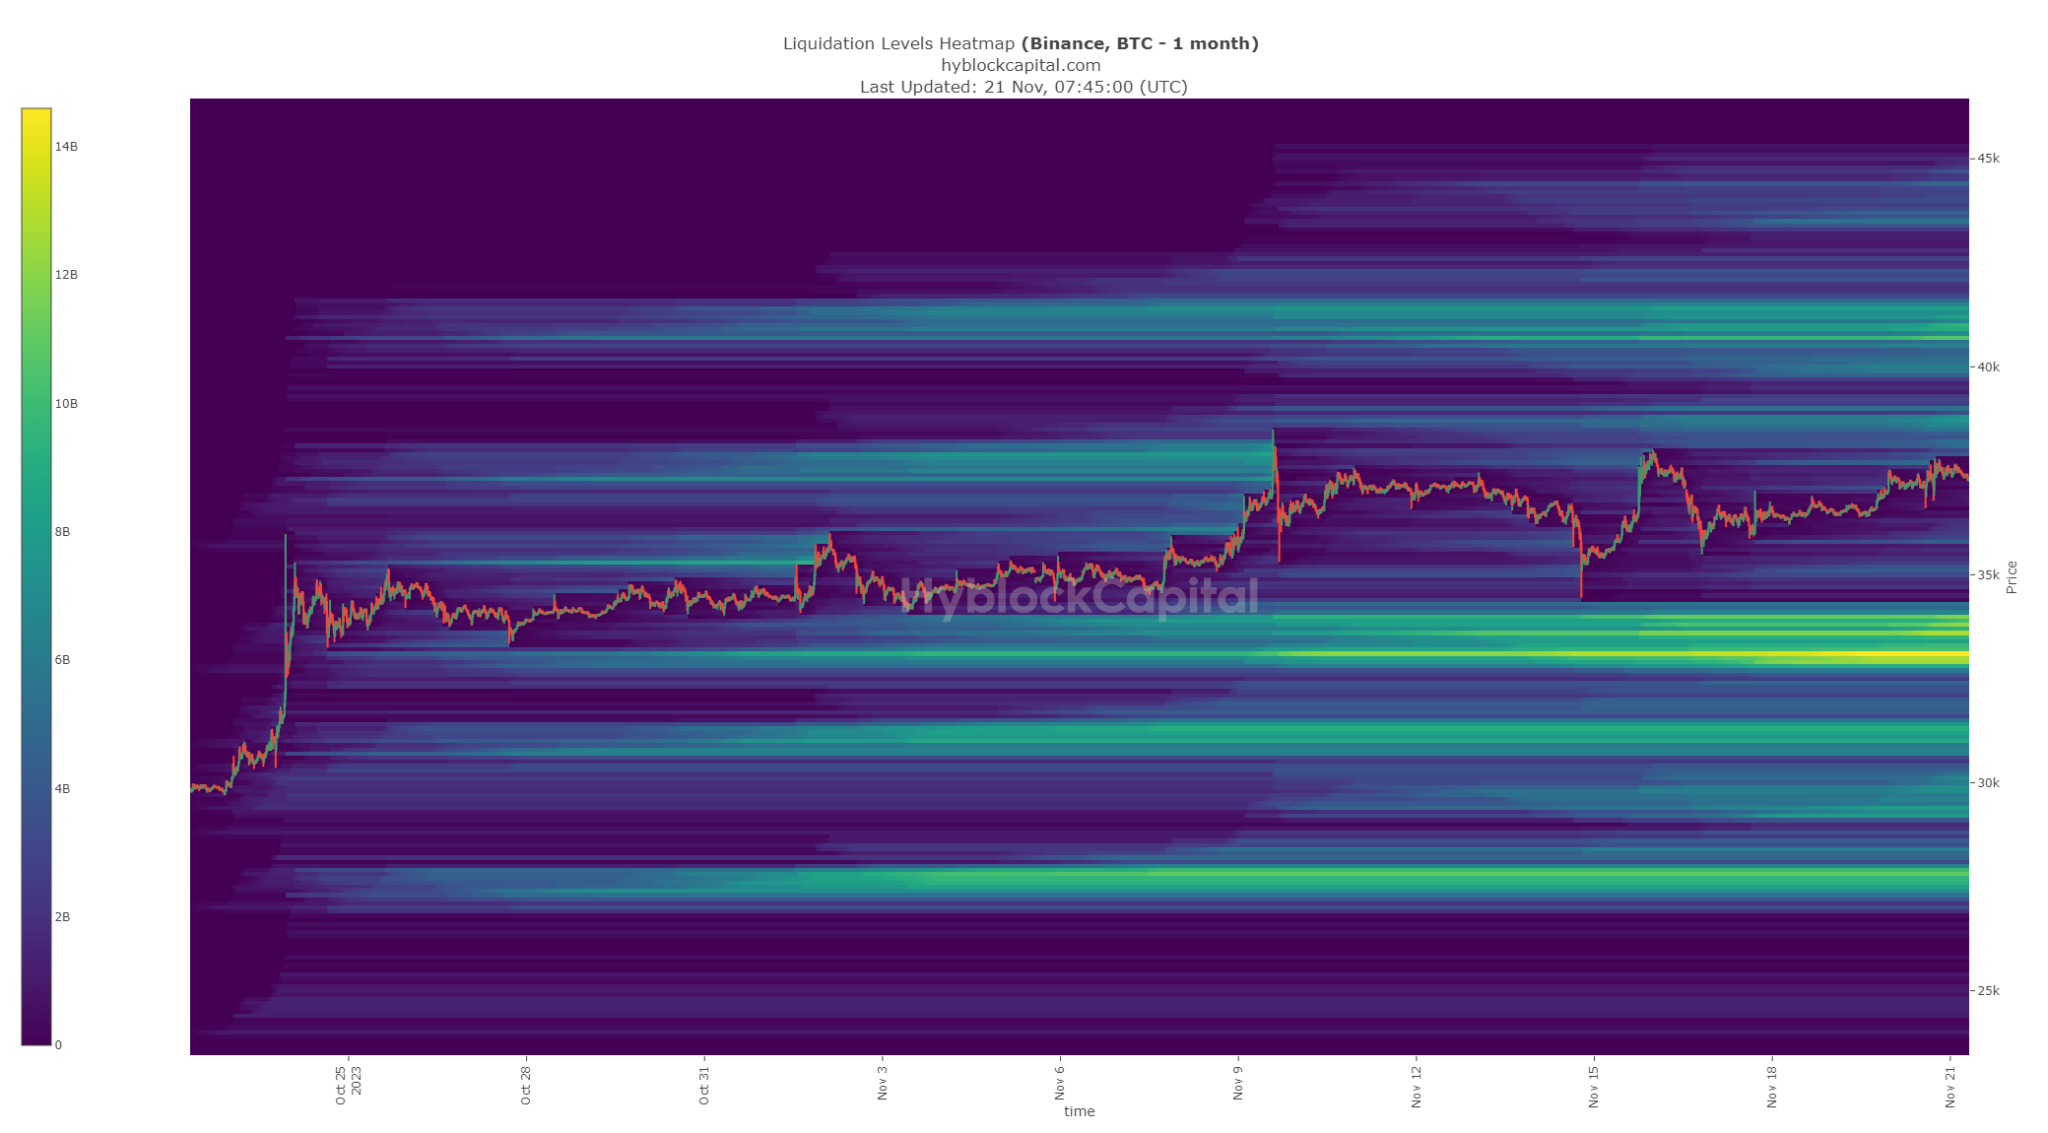
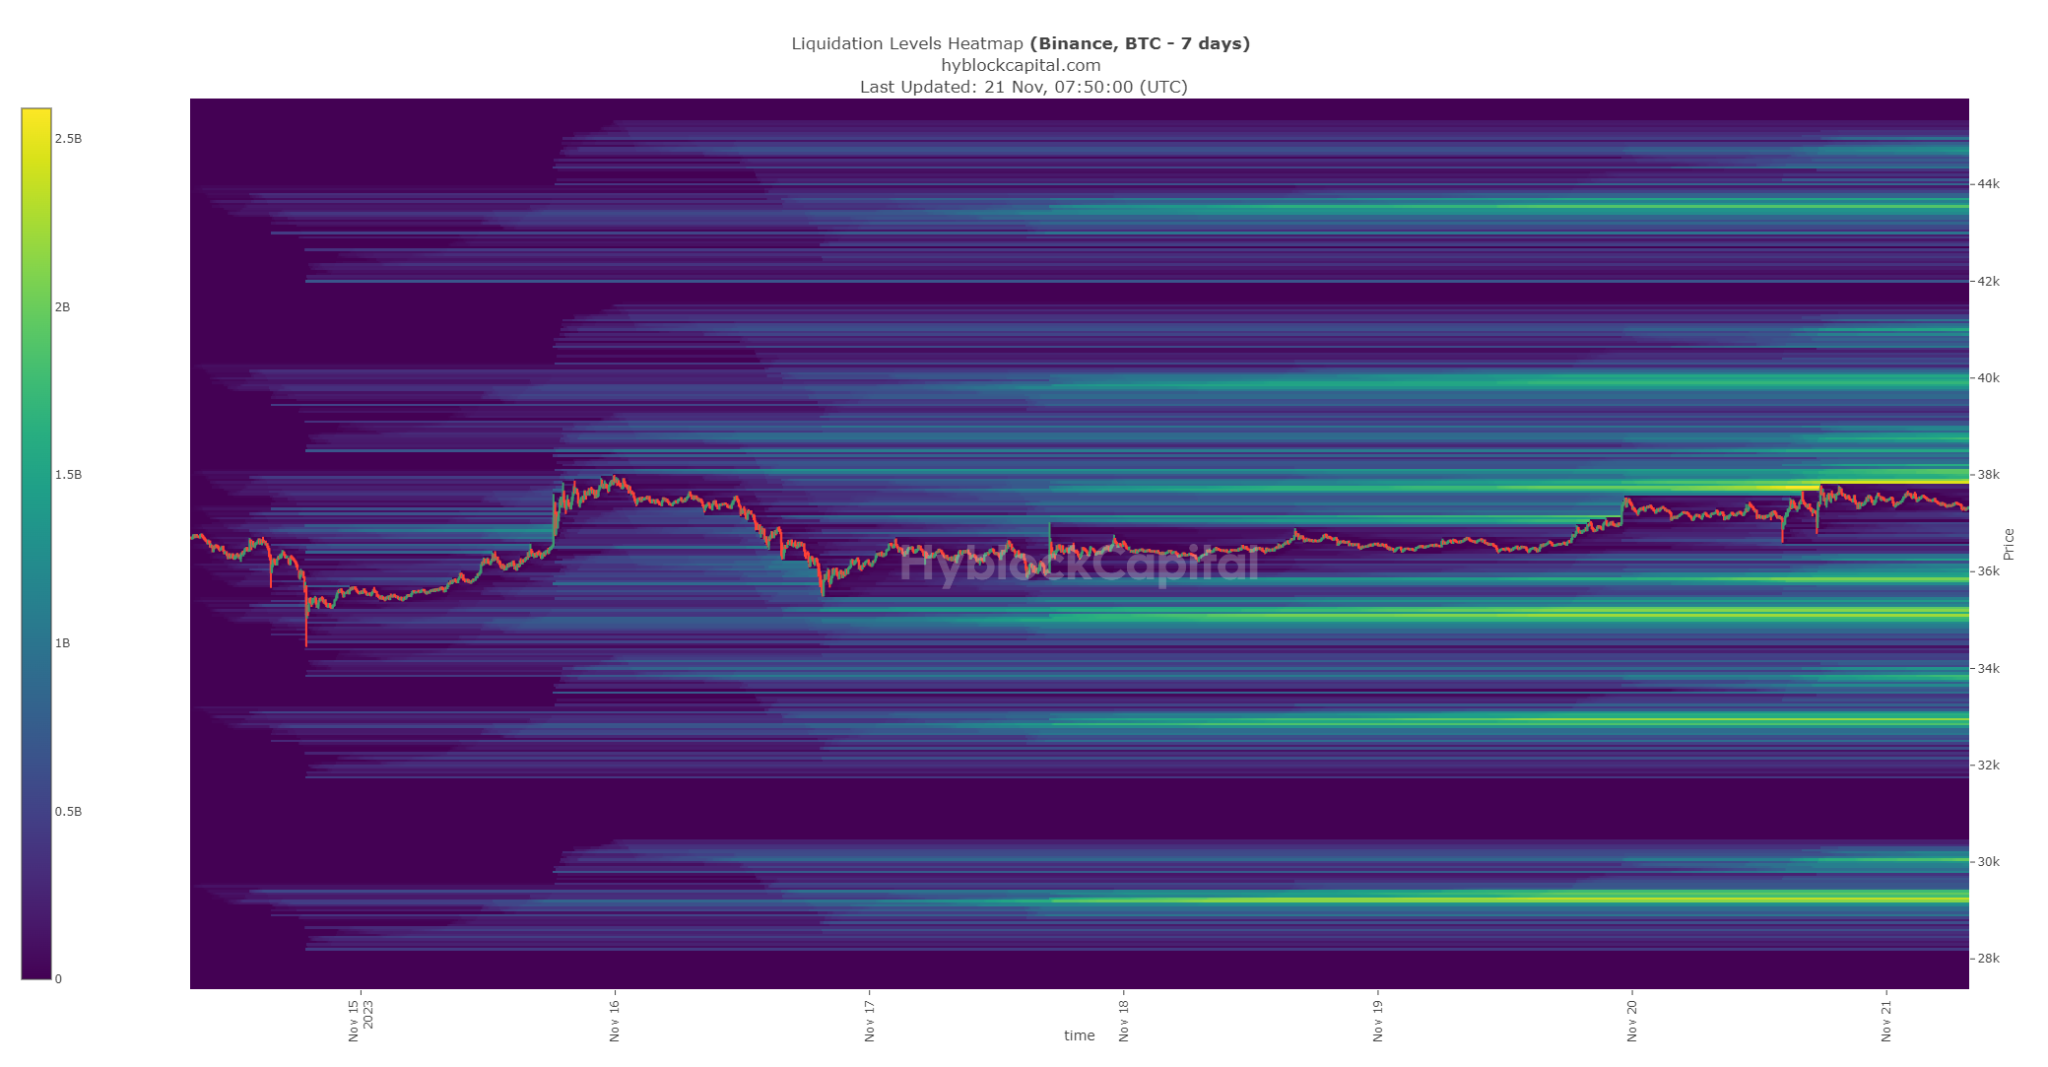
Hyblock Charts: Initiating with the 1-month chart, as previously discussed in recent updates, there are no significant yellow zones above the current price. However, a level is gradually developing around the $40,700 area, although it hasn’t yet transitioned to yellow. Below the price, a substantial zone ranging from $34,100 to $32,900 has turned yellow since last week’s update. Shifting to the 7-day chart, there is a yellow zone at $37,850 above the price, and below the price, no yellow zones have emerged yet, but attention is directed towards $35,900 and $35,200 as the closest two levels.
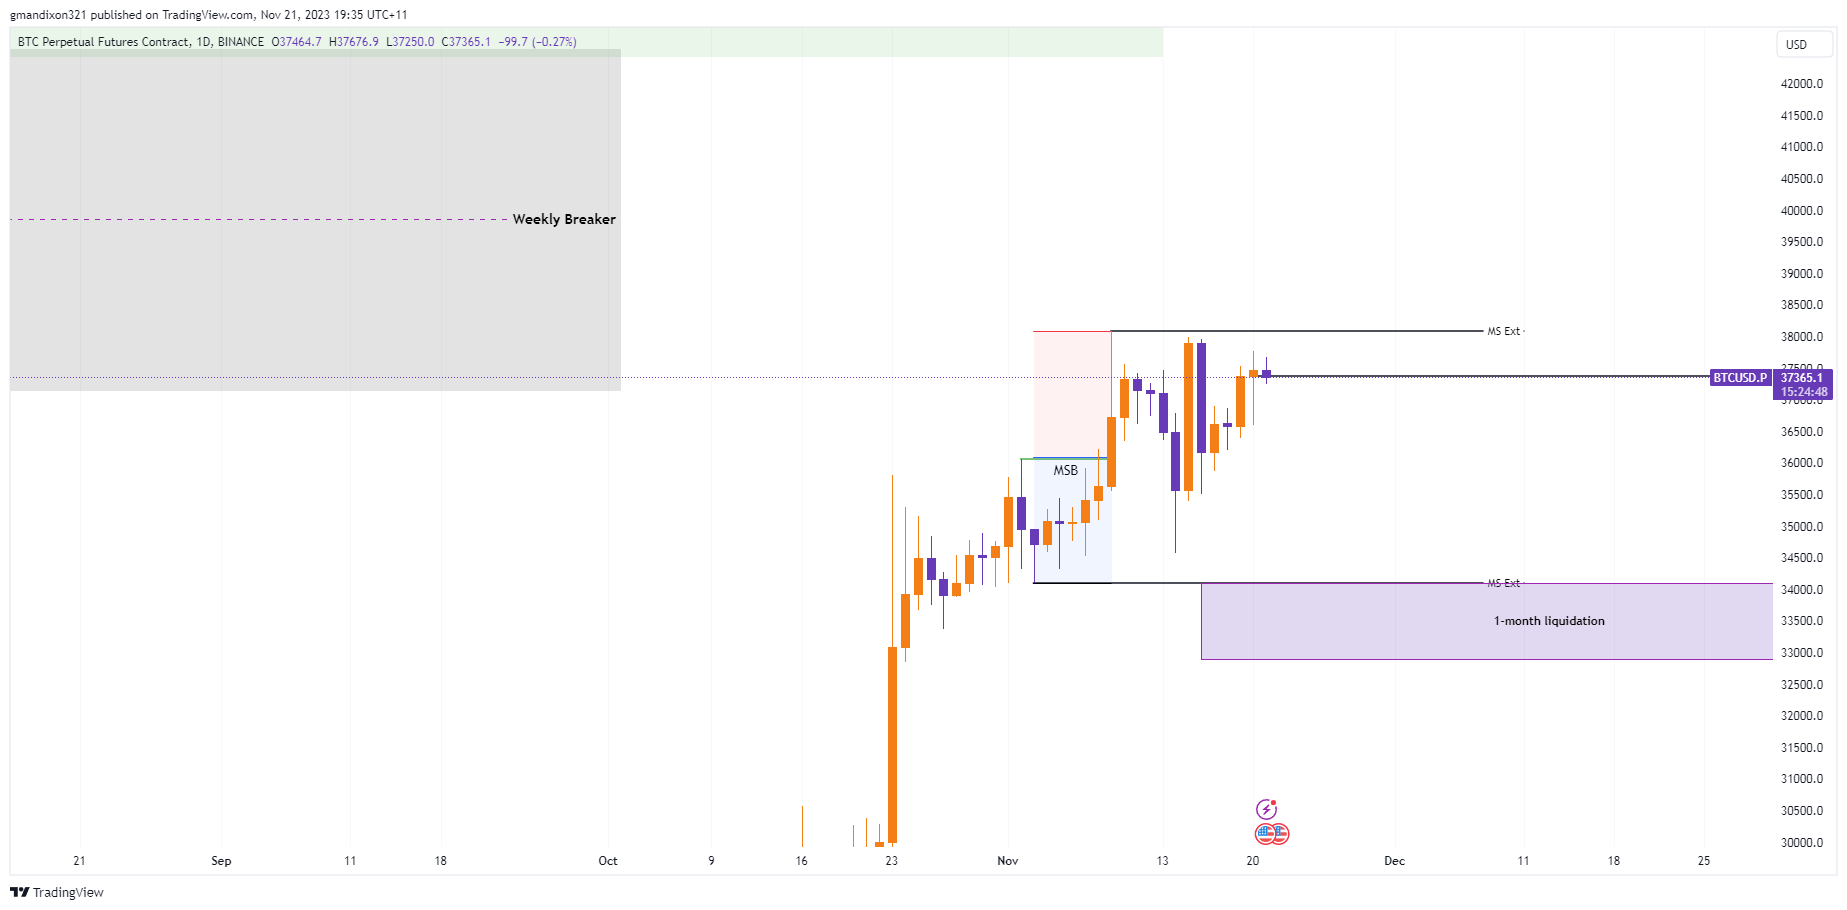
Bitcoin Chart (Daily): Moving on to the daily Bitcoin chart, we observe consolidation within the new daily range since last week, transitioning from the daily range discount to the daily range premium.
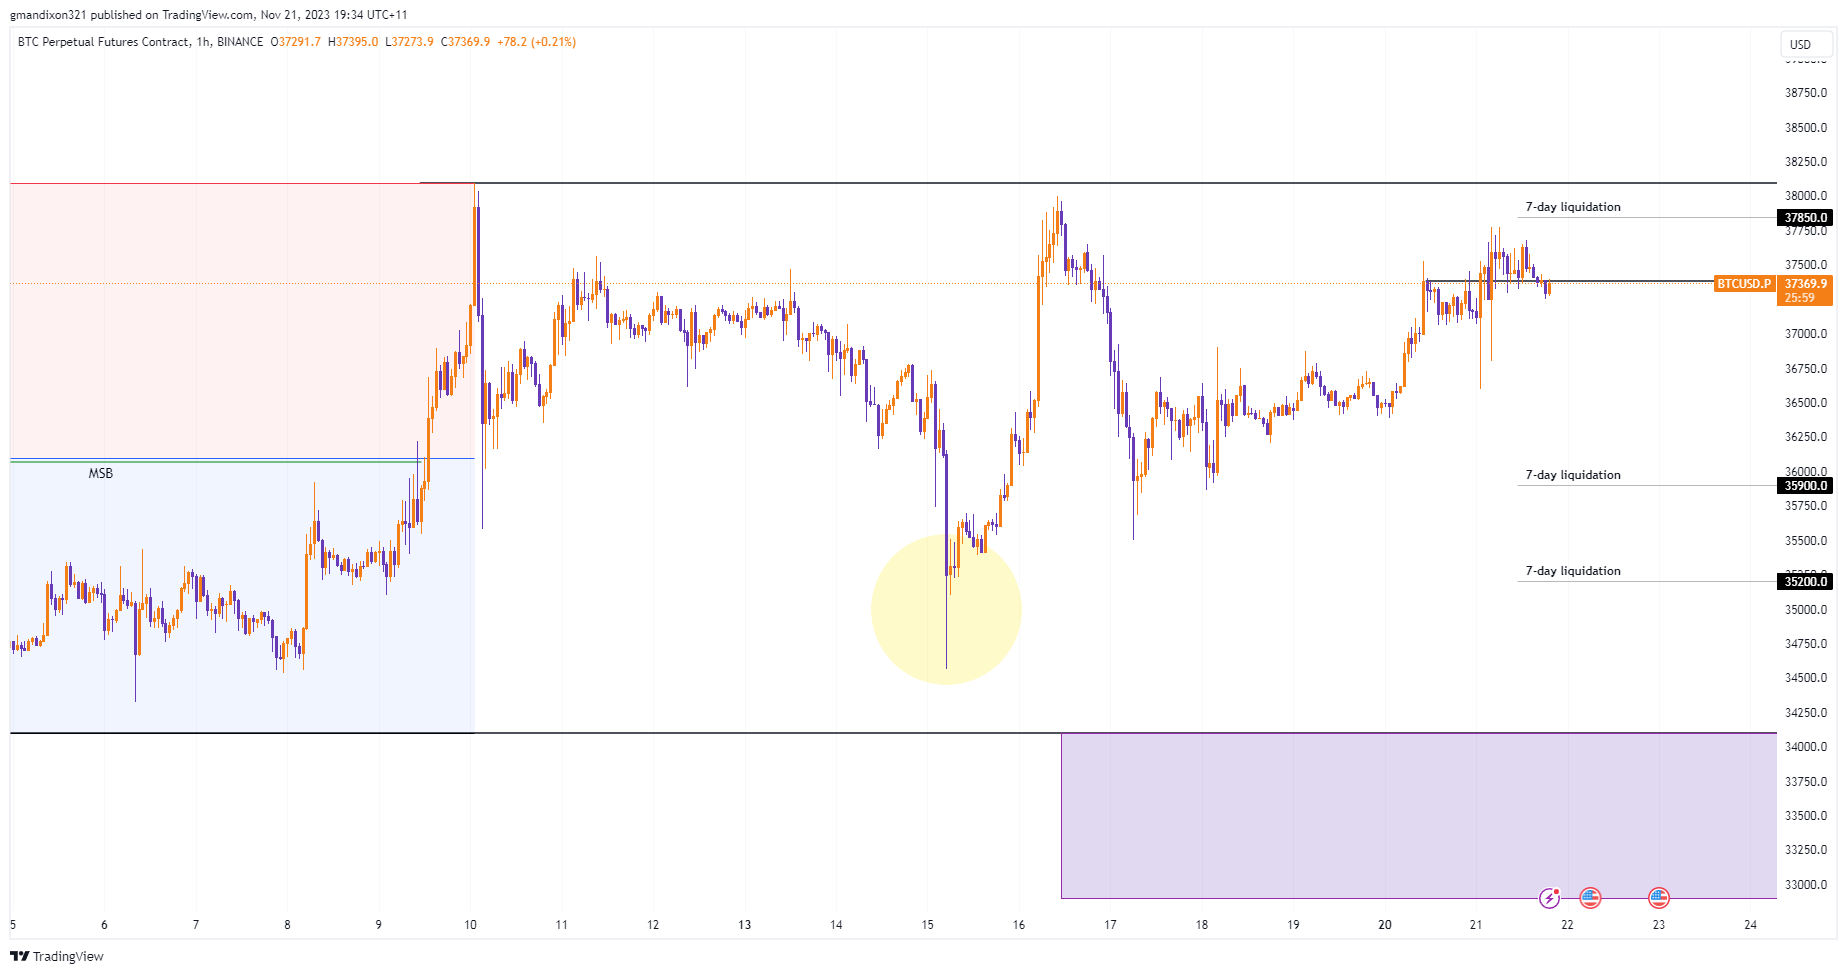
Bitcoin Chart (H1): Turning our attention to the H1 chart, as mentioned last week, I had intended to look for an H1 long setup at the 7-day liquidation level. While I didn’t enter a long position, the price did react favorably in that area, bouncing up into the premium of the daily range. Examining the current H1 chart, a 7-day Hyblock liquidation level has now formed just above the price and in proximity to the daily range high. I will closely monitor this level and watch for an H1 reaction, considering it as a potential opportunity to initiate a short position.


Welcome to the Bitcoin & Hyblock Update!
Hyblock Charts: Initiating with the 1-month chart, as previously discussed in recent updates, there are no significant yellow zones above the current price. However, a level is gradually developing around the $40,700 area, although it hasn’t yet transitioned to yellow. Below the price, a substantial zone ranging from $34,100 to $32,900 has turned yellow since last week’s update. Shifting to the 7-day chart, there is a yellow zone at $37,850 above the price, and below the price, no yellow zones have emerged yet, but attention is directed towards $35,900 and $35,200 as the closest two levels.
Bitcoin Chart (Daily): Moving on to the daily Bitcoin chart, we observe consolidation within the new daily range since last week, transitioning from the daily range discount to the daily range premium.
Bitcoin Chart (H1): Turning our attention to the H1 chart, as mentioned last week, I had intended to look for an H1 long setup at the 7-day liquidation level. While I didn’t enter a long position, the price did react favorably in that area, bouncing up into the premium of the daily range. Examining the current H1 chart, a 7-day Hyblock liquidation level has now formed just above the price and in proximity to the daily range high. I will closely monitor this level and watch for an H1 reaction, considering it as a potential opportunity to initiate a short position.
Weekly Economic Data
https://skribr.io/app/news/weekly-economic-data-summary-3/
Wishing everyone a successful trading week ahead!